PHASE 1 BALANCED FLOW METER
TEST SCREENING RESULTS AND ANALYSIS
February 20, 2005
TABLE OF CONTENTS
Executive
Summary.
Forward.
Technical
Background.
Summary
and Results.
Conclusions
and Recommendations.
Test
Facility and Equipment
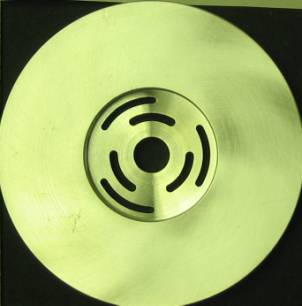
Figure
1 Slotted Configuration.
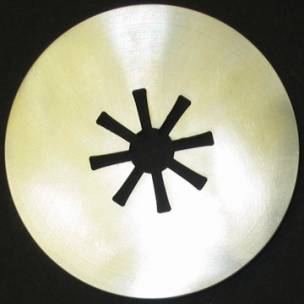
Figure
2 Iron Cross Configuration.
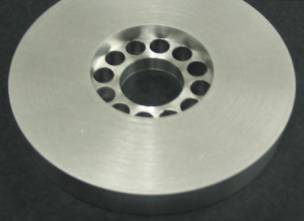
Figure
3 Single Ring of Holes Configuration.
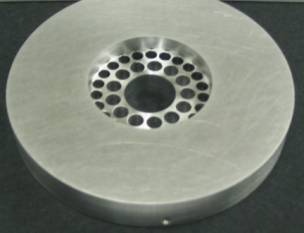
Figure
4 Custom Hole Configuration.
Figure
5 Standard Blunt Edge Orifice.
Figure
6 - Test Lab (Photo 111)
Figure
7 - Flow Skid (Photo 4631)
Figure
8 - Flow Skid Diagram..
Figure
9 - Equipment Compressor (Photo 0481F)
Figure
10 - Equipment Cooler/Dryer (Photo 0476F)
Table 1 - Summary Results
for Inline Hole Configuration using Flange Taps.
Table
2 - Comparisons of the Velocity Head Factors.
Table
3 - Summary Results for Plate Configuration using Flange Taps.
This
report provides the testing results various balanced flow meter configurations
with comparisons to orifice designs and theoretical (text book) venturi meter
design. Over thirty (30) Balanced
Flow Meter (BFM) plates were tested in compressed air as part of this study
with a wide range of beta factors (0.25 to 0.9x) and configurations which
include the inline, inline and staggered, staggered, slotted, and iron cross.
More than ninety (90) flow tests were conducted which included the
straight run pipe flow meter design, double elbow configurations, smoke and
sand tests, i.e., fouling. Flow conditions for this testing were selected to range from
medium flow to sonic conditions, as applicable. This approach rigorously verifies the gas equations used in
both the orifice and venturi meter-sizing basis and is most suited for plate
design screening and performance evaluations.
The
Balanced Flow Meter approaches a venturi meter performance, with respect to:
1.) Discharge coefficient (Cd)
value and
2.) Permanent pressure loss, as
determined through the velocity head loss, K-factor method
Results
of this testing show that the Balanced Flow Meter plate design far exceeded
the standard knife-edged orifice in all aspects such as:
1.)
Discharge coefficient (Cd), which represents measurement accuracy
2.)
Permanent pressure loss, as determined through the velocity head
pressure loss, K-factor method
3.)
Vibration and acoustic noise generation
Last,
the results of this testing show that the Balanced Flow Meter Plates suffered
little performance degradation after being placed immediately in front of or
immediately behind two 90 degree out of plane elbows.
In both cases, the Balanced Flow Plate was within 2 pipe diameters of
the inner elbow bend, which is the closest possible in the pipe schedules
tested. Based on the physics of
the plate, it is believed that the Balanced Flow Meter Plates will not
significantly degrade when placed at least 1 (one) pipe diameters in front of
or behind a major disturbance.
This
is a significant technical advancement in the science of flow metering and
plate design. The Balanced
Flow Meter is a single plate design similar to the orifice plate; however, its
performance reveals a substantial improvement.
The venturi meter is the gold standard for head meter flow measurement
systems. The Balanced Flow Meter
plate approaches the performance of this standard resulting in significant
cost reduction due to simpler installed piping requirements, lower
manufacturing costs and lower operating costs, when compared to the venturi
meter.
The Balanced Flow Meter Measurement
device has been tested and verified. This
new and unique device utilizes a patent pending multi-hole layout design.
Results show that this new flow meter design provides a one-hundred
percent (100%) increase in pressure recovery, a ten-fold increase in accuracy,
and a fifteen-to-one (15 to 1) reduction in power intensity (i.e. noise
reduction) when compared to a standard knife-edged orifice meter.
Results show that the Balanced Flow Meter plate approaches the
performance of a venturi meter. This
report provides the results of this testing and data analysis.
The Balanced Flow Meter Measurement
device is used for determination of the fluid flow rate in a piping, channel,
or conduit system. Fluid flow
measurement is used extensively in the fluid processing industries, such as
chemical plants, refineries, power plants, pharmaceutical plants, pulp and
paper plants, etc. The Balanced
Flow Meter Measurement device tested introduces new design features that
significantly improve measurement accuracy, pressure recovery and noise
reduction and is a direct replacement for the highly used orifice plate
design. This new design concept
is applicable to all NASA fluid flow measurement activities and has been
introduced into industrial applications with favorable results.
Within the fluid-chemical process
industries, there is a significant need to improve fluid flow measurement
capabilities. The bulk of current
designs include orifice plate, vortex, wedge, vibrating tube,
positive-displacement, time-of-flight, venturi, etc., all of which can be
expensive to operate and / or manufacture, can be noisy, can cause excessive
pressure loss, can cause damage due to excessive vibrations, and / or can
require extensive calibration and maintenance.
These systems have also proven to be unreliable or unsuitable for
certain applications and their benefits and weaknesses are typically highly
dependent on fluid properties and process conditions.
This new and novel Balanced Flow
Meter Measurement design is configured to minimize pressure loses by balancing
the kinetic and momentum affects across the radius of a pipe and plate.
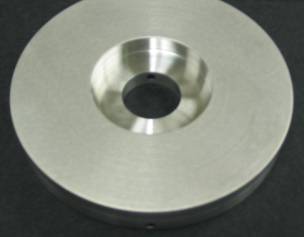
Examples of the different physical configurations along with the
standard blunt edge orifice are shown in the following figures:
This balanced flow configuration has
shown to be superior in performance when compared to the standard orifice
plate. The performance approaches
the venturi meter in coefficient of discharge value and velocity head factor.
The technical basis for orifice, venturi, and the Balanced Flow Meter
analysis follows:
General
Orifice and Venturi Equation
The mass flow rate across an orifice
plate is based on the following equation as derived from the total energy
balance. This equation applies to
both liquid and gas flow.
 Equation 1
where
 is the mass flow rate,
 is the average pipe or orifice
fluid velocity
 is the pipe or orifice area
 is the fluid density through the
pipe or orifice
 is the orifice or venturi
coefficient of discharge
 is the orifice or venturi throat
area
 is the orifice or venturi gas expansion coefficient
 is the open area to pipe area
ratio to the 1/2 power
 is Newton’s gravitational
conversion constant
 is the pressure, and
where “a” is the upstream
condition and “b” is the downstream condition.
The Balanced Flow Meter plate design
has been tested and shown to be accurate in determining the flow rate of
fluids in piping systems. The
Inline Hole Configuration was the most consistent performer throughout the
Beta values tested, although by only a slight margin.
The other multi-hole configurations were comparable.
The Iron Cross Beta .5002 showed excellent results, however the larger
sizes were not as good, lending thought that the design of those sizes may
need further optimization and testing. This
configuration is very unique and adds some features that can be readily
applied to other applications and devices, and therefore should be a test
program priority, along with the multi-hole configurations. The Radial Slot configuration has similar performance to the
Iron Cross configuration, plus it is less tedious to design and less expensive
to build. It may also have some
flow conditioning advantages around pipe bends.
The following table provides summary
results for the inline hole configuration of the Balanced Flow Meter using
flange taps.
Table
1 -
Summary Results for Inline Hole Configuration using Flange Taps
(Return to List of Tables and Data)
|
BETA
|
0.25
|
0.500
|
0.521
|
0.650
|
0.500,fouled
|
0.500,elbow
|
|
Avg Cd
|
0.892
|
0.882
|
0.881
|
0.911
|
0.824
|
0.848
|
|
Cd Dev
|
0.032
|
0.001
|
0.009
|
0.010
|
0.038
|
0.008
|
|
Avg K Val
|
287.1
|
16.3
|
13.2
|
4.0
|
15.65
|
18.63
|
|
K Dev
|
20.8
|
0.60
|
0.53
|
0.16
|
1.23
|
0.38
|
As the above table shows, the
average Cd value is relatively constant for the beta factor range from 0.25 to
0.650, within experimental error. The
Balanced Flow Meter plate is only slightly affected by fouling and
upstream/downstream disturbances. Additionally,
the average Cd factor of 0.89 is in the range of the venturi Cd coefficient
that typically spans from 0.80 to 0.96. The
standard orifice Cd factor is 0.61.
The disturbances used in this
testing conform to the API MPMS 5.7 Testing Protocol for Differential Pressure
Flow Measurement Devices Section 3.1.1.2 for two adjoining (close coupled)
out-of-plane 90 degree elbows. These
double elbows were placed 2 diameters upstream and 2 diameters downstream,
which is the minimum distance possible with the pipe schedules tested.
During these stringent tests, the Balanced Inline plate Cd factor
stayed above 0.85 throughout the range of minimum flow rates to sonic flow
conditions (the best performing Balanced configuration stayed above 0.92).
The following table provides
comparisons of the velocity head factor with the orifice and venturi meters
for various beta factors. As this
table depicts, the velocity head K factor value is significantly reduced when
compared to an orifice plate. The
K values for the venturi meter are ideal and represent a lower limit.
Actual values for venturi meters can be fifty percent (50%) higher or
more, dependent on Cd value, diffuser design and pipe roughness.
Table
2 -
Comparisons of the Velocity Head Factors
(Return to List of Tables and Data)
|
BETA
|
0.25
|
0.500
|
0.521
|
0.650
|
|
Venturi K, Cd=0.96
|
134.2
|
5.8
|
4.7
|
1.3
|
|
Venturi K, Cd=0.80
|
255.9
|
12.9
|
10.7
|
3.5
|
|
BFM K
|
287.1
|
16.3
|
13.2
|
4.0
|
|
Orifice K
|
669.4
|
31.5
|
25.7
|
7.4
|
A typical coefficient of discharge
plot is shown below.
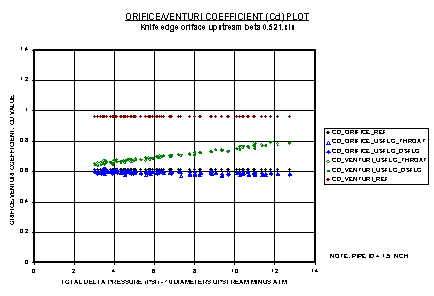
The above plot is for the standard
knife edge orifice and shows the Cd values for various calculation methods. These methods include sizing based on the orifice equation
and sizing based on the venturi equation.
As this figure shows, the orifice equation is applicable for the
orifice meter since the Cd value is constant across the flow range.
Also shown are the typical Cd limits for the orifice plate and a
venturi meter.
As a comparison example, the
following plot is for the standard for the Balanced Flow Meter plate.
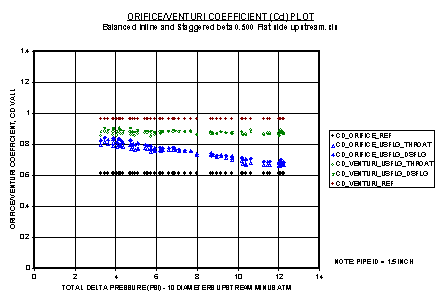
The above
plot shows that the Balanced Flow Meter design follows the venturi meter
equation and that the Cd values approach that of a high quality venturi meter
with a Cd value of 0.96. For this
example, the Cd value of the Balanced Flow Meter plate is 0.88.
The range for a venturi meter is typically 0.80 to 0.96.
The Cd value for a standard orifice plate is 0.61.
These plots
also show that certain data on the low end of flow were filtered, due to
signal to noise ratio issues at low flow rates.
The differential pressure sensors used had a range to thirty (30) PSI.
As with all differential pressure sensors, the turn down ratio (range)
of these meters is limited. In industry, a turn down of five to one (5 to 1) is common.
The sensors used for this testing surpassed this turn down ratio, as
they were of high quality. Low flow data values were cut based on signal to noise
affects. The approach of using
high range differential pressure sensors was to ensure capabilities in the
critical (sonic) flow regions of testing.
This provided verification of equations and equation applicability
under the most severe conditions.
Analysis for each test includes the
average, deviation, intercept and slope for the discharge coefficients and K
values. The slope and intercept
are related to the linearity of the plate and the deviation is related to the
sensitivity or accuracy of the plate. The
higher the average value for the Cd coefficient, the closer the plate
approaches an ideal “head” type flow meter.
A value of one (1) would indicate ideal.
The lower the K factor implies lower permanent pressure loss. A value of zero (0) would indicate no pressure loss across
the meter assembly. However, due
to impulse momentum effects, when accelerating and decelerating flows, a
permanent pressure loss will occur. The
ideal limit is a function of the beta factor and typically referenced to the
venturi meter permanent pressure loss.
Based on the requirements for high
linearity and minimum deviation across the flow and beta factor range, the
best plate configuration is the inline Balanced Flow Meter.
The statistical results for this meter are given in Table 1.
Other plate configurations may show a higher Cd coefficient.
Due to variation of the Cd coefficient for change in beta factor with
other Balanced Flow Meter configurations, test results indicate that the
inline Balanced Flow Meter is the best design for industrial applications.
For high flow (high beta)
applications, the staggered, inline-staggered or iron cross configurations can
be utilized. Verification of the
Cd and K values is recommended. The
following table provides a summary listing of the average and deviation for
the Cd and K values for plate configurations and test runs.
The flange tap reference is used in this table since this is the most
commonly used design and had the most data compared to the throat tap
orientation. Table references
with empty values indicate that a plate with its associated configuration was
not selected for testing.
This table may be used to estimate
Cd and K values for beta factors not listed.
Comparison results for selecting an optimum design and additional
testing requirements can also be reviewed with this table.
Most notable is the multiple N1-13 N2-23 configuration with Cd values
above 0.99. Additional testing
should be performed with this design for the high flow requirements related to
Marshall Space Flight Center (MSFC) applications.
Last, testing to determine the minimum significant pipe disturbance
distances upstream and downstream should be conducted.
Table
3 -
Summary Results for Plate Configuration using Flange Taps
(Return to List of Tables and Data)
|
Inline
|
BETA
|
0.25
|
0.486
|
0.500
|
0.521
|
0.619
|
0.650
|
0.733
|
0.750
|
0.803
|
0.8147
|
0.950
|
0.500,
fouled
|
0.500,
el
up
|
0.500,
el
dn
|
|
|
|
|
|
0.882
|
0.881
|
|
0.911
|
|
|
|
|
|
0.824
|
0.848
|
0.870
|
|
|
Cd
Dev
|
0.032
|
|
0.001
|
0.009
|
|
0.010
|
|
|
|
|
|
0.038
|
0.008
|
0.006
|
|
|
|
|
|
16.3
|
13.2
|
|
4.0
|
|
|
|
|
|
15.7
|
18.6
|
17.3
|
|
|
K
Dev
|
20.8
|
|
0.6
|
0.5
|
|
0.2
|
|
|
|
|
|
1.2
|
0.3
|
0.3
|
|
Inline
&
Stag
|
BETA
|
0.25
|
0.486
|
0.500
|
0.521
|
0.619
|
0.650
|
0.733
|
0.750
|
0.803
|
0.8147
|
0.950
|
0.500,
fouled
|
0.500,
elbow
|
0.500,
el
dn
|
|
|
Avg
Cd
|
0.877
|
|
0.877
|
|
|
0.946
|
|
|
|
|
|
0.893
|
0.879
|
0.870
|
|
|
Cd
Dev
|
0.027
|
|
0.010
|
|
|
0.016
|
|
|
|
|
|
0.010
|
0.010
|
0.006
|
|
|
Avg
K Val
|
298.3
|
|
17.0
|
|
|
4.2
|
|
|
|
|
|
16.3
|
18.2
|
17.6
|
|
|
K
Dev
|
17.7
|
|
0.5
|
|
|
0.1
|
|
|
|
|
|
0.5
|
0.3
|
0.2
|
|
Stag
|
BETA
|
0.25
|
0.486
|
0.500
|
0.521
|
0.619
|
0.650
|
0.733
|
0.750
|
0.803
|
0.8147
|
0.950
|
0.500,
fouled
|
0.500,
elbow
|
0.500
dbl
el
|
|
|
Avg
Cd
|
0.829
|
|
0.865
|
0.894
|
|
|
|
0.964
|
|
|
|
|
|
0.863
|
|
|
Cd
Dev
|
0.036
|
|
0.012
|
0.015
|
|
|
|
0.036
|
|
|
|
|
|
0.007
|
|
|
Avg
K Val
|
334.7
|
|
17.3
|
13.3
|
|
|
|
1.7
|
|
|
|
|
|
18.4
|
|
|
K
Dev
|
28.1
|
|
0.7
|
0.2
|
|
|
|
0.1
|
|
|
|
|
|
0.3
|
|
Knife
Edge
|
BETA
|
0.25
|
0.486
|
0.500
|
0.521
|
0.619
|
0.650
|
0.733
|
0.750
|
0.803
|
|
|
|
|
1.7
|
|
|
Iron
Cross
|
BETA
|
0.25
|
0.486
|
0.5002
|
0.521
|
0.619
|
0.650
|
0.733
|
0.750
|
0.803
|
0.8147
|
0.950
|
0.500,
fouled
|
0.5002,
el
up
|
0.5002
el
dn
|
|
|
Avg Cd
|
|
|
0.939
|
|
|
0.818
|
0.814
|
|
|
|
|
|
0.936
|
0.923
|
|
|
Cd
Dev
|
|
|
0.011
|
|
|
0.007
|
0.012
|
|
|
|
|
|
0.012
|
0.010
|
|
|
Avg
K Val
|
|
|
14.3
|
|
|
4.6
|
2.4
|
|
|
|
|
|
14.9
|
15.0
|
|
|
K
Dev
|
|
|
0.6
|
|
|
0.1
|
0.1
|
|
|
|
|
|
0.3
|
0.2
|
|
Slotted
|
BETA
|
0.25
|
0.486
|
0.500
|
0.521
|
0.619
|
0.650
|
0.733
|
0.740
|
0.803
|
0.8147
|
0.950
|
0.500,
fouled
|
0.500,
elbow
|
0.500,
el
dn
|
|
|
|
|
|
0.820
|
|
|
0.816
|
|
0.841
|
|
|
|
|
0.857
|
0.847
|
|
|
Cd
Dev
|
|
|
0.009
|
|
|
0.009
|
|
0.010
|
|
|
|
|
0.008
|
0.010
|
|
|
Avg
K Val
|
|
|
17.0
|
|
|
4.7
|
|
2.1
|
|
|
|
|
18.0
|
17.8
|
|
|
K
Dev
|
|
|
0.4
|
|
|
0.1
|
|
0.1
|
|
|
|
|
0.3
|
0.3
|
|
Radial
Slotted
|
BETA
|
0.25
|
0.486
|
0.50
|
0.521
|
0.619
|
0.650
|
0.733
|
0.740
|
0.803
|
0.8147
|
0.950
|
0.500,
fouled
|
0.500,
elbow
|
0.500
dbl
el
|
|
|
Avg
Cd
|
|
|
0.857
|
|
|
0.733
|
0.740
|
0.803
|
0.8147
|
0.950
|
0.500,
fouled
|
0.500,
elbow
|
0.500
dbl
el
|
|
|
Avg
Cd
|
|
|
|
0.582
|
|
|
|
|
|
|
|
|
|
|
|
|
Cd
Dev
|
|
|
|
0.005
|
|
|
|
|
|
|
|
|
|
|
|
|
Avg K Val
|
|
|
|
21.5
|
|
|
|
|
|
|
|
|
|
|
|
|
K
Dev
|
|
|
|
1.2
|
|
|
|
|
|
|
|
|
|
|
|
N1-13
N2-23
|
BETA
|
0.25
|
0.486
|
0.5002
|
0.521
|
0.619
|
0.650
|
0.733
|
0.750
|
0.803
|
0.8147
|
0.950
|
0.500,
fouled
|
0.500,
elbow
|
0.500
dbl
el
|
|
|
Avg Cd
|
|
|
|
|
|
|
|
1.025
|
0.994
|
|
|
|
|
|
|
|
Cd
Dev
|
|
|
|
|
|
|
|
0.014
|
0.030
|
|
|
|
|
|
|
|
Avg
K Val
|
|
|
|
|
|
|
|
1.7
|
1.1
|
|
|
|
|
|
|
|
K
Dev
|
|
|
|
|
|
|
|
0.0
|
0.0
|
|
|
|
|
|
|
Single
Ring
|
BETA
|
0.25
|
0.486
|
0.5002
|
0.521
|
0.619
|
0.650
|
0.733
|
0.740
|
0.803
|
0.8147
|
0.950
|
0.500,
fouled
|
0.500,
elbow
|
0.500
dbl
el
|
|
|
Avg
Cd
|
|
|
|
|
|
|
|
|
|
0.932
|
|
|
|
|
|
|
Cd
Dev
|
|
|
|
|
|
|
|
|
|
0.027
|
|
|
|
|
|
|
Avg K Val
|
|
|
|
|
|
|
|
|
|
1.1
|
|
|
|
|
|
|
K
Dev
|
|
|
|
|
|
|
|
|
|
0.0
|
|
|
|
|
|
Blunt
Edge
|
BETA
|
0.25
|
0.486
|
0.500
|
0.521
|
0.619
|
0.650
|
0.733
|
0.740
|
0.803
|
0.8147
|
0.950
|
0.25,
fouled
|
0.500,
el
up
|
0.500
el
dn
|
|
|
Avg
Cd
|
0.672
|
|
0.619
|
|
|
0.620
|
|
|
|
|
0.615
|
0.621
|
0.649
|
0.625
|
|
|
Cd
Dev
|
0.028
|
|
0.005
|
|
|
0.016
|
|
|
|
|
0.028
|
0.023
|
0.010
|
0.006
|
|
|
Avg
K Val
|
353.2
|
|
21.9
|
|
|
6.3
|
|
|
|
|
0.3
|
26.2
|
22.6
|
21.8
|
|
|
K
Dev
|
35.8
|
|
1.6
|
|
|
0.3
|
|
|
|
|
0.0
|
1.9
|
1.0
|
0.8
|
The test facility included the various
flow runs that housed the plates (see picture below) and the A+ FlowTek
compressor, cooler/dryer, and flow skid system.
All testing was performed at NASA/Marshall Space Flight Center (MSFC).
MSFC also provided all instrumentation and data logging equipment.
Calibration of all instrumentation, sensors, and turbine meter were
performed at MSFC.
Figure 6 - Test Lab (Photo 111)
(Return to List of Figures)
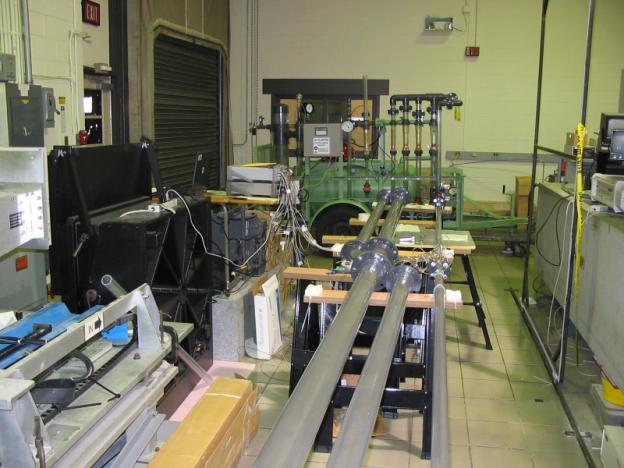
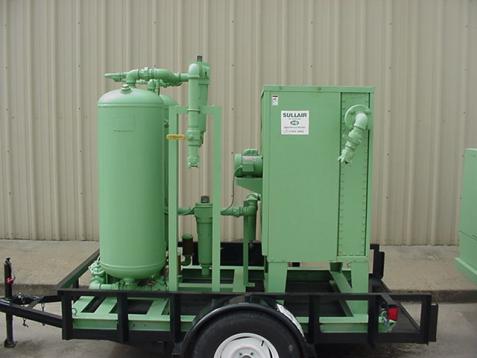
The Balanced Flow Meter Measurement
System test stand is comprised of a 1 1/2 inch clear PVC piping, plate mounting
flanges, pressure and temperature sensors, and an air-calibrated roto-meter.
Monitoring of the data was with Lab View for data acquisition and
storage. Picture of the flow meter
test stand, flow meter skid diagram and the compressor with cooler/dryer system
are shown below.
Figure 8 - Flow Skid Diagram
(Return to List of Figures)
Figure 7 - Flow Skid
(Photo 4631)
(Return to List of Figures)
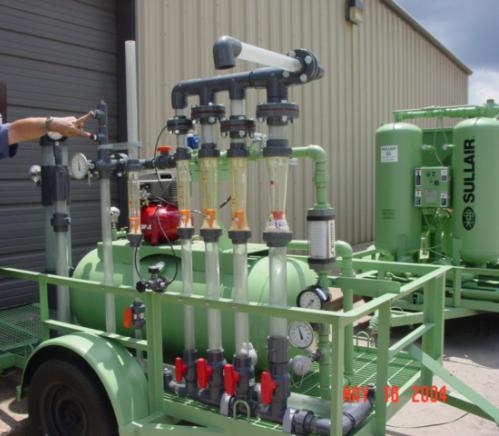
Figure
9 -
Equipment Compressor (Photo 0481F) (Return
to List of Figures)

Figure
10 -
Equipment Cooler/Dryer (Photo 0476F)
(Return to List of Figures)
(Return
to TOC)
